http://upload.wikimedia.org/wikipedia/commons/4/47/Cartlinearlarge.png
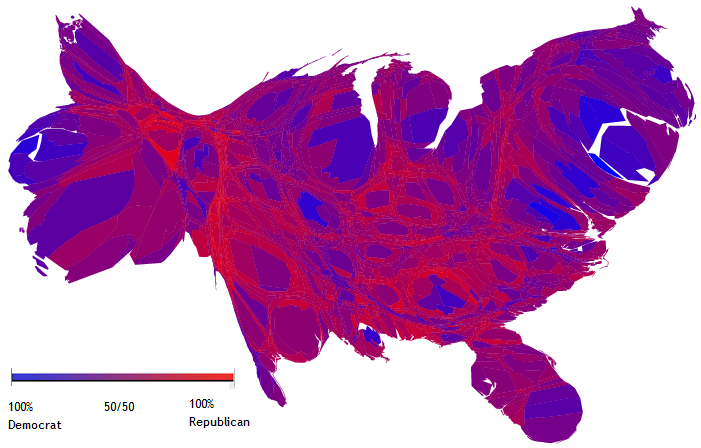
A cartogram is a map that skews the picture to show a larger or smaller amount of what is being presented. This cartogram shows how each county voted in the 2004 election. The areas skewed to look larger are those that had more people voting for a certain candidate.
No comments:
Post a Comment